About ESI   |   Contact Us   |   Locations   |   Careers
Elemental Scientific - Innovative Leaders in Semiconductor Online Monitoring, Laboratory Automation, Laser Ablation, Glassware & Nebulization

Speciation/Chromatography Systems

Xceleri Software for Automated Speciation Analysis

Xceleri is a simple but powerful tool that makes processing chromatographic data possible for any level of user.

Automated Analysis

  • Easy to build methods for total metals & LC-ICPMS (or LC-ICP) measurements
  • Control of the prepFAST IC and ICPMS all within one software
  • Build analysis list for calibration, QC, and samples
  • Automated QC and sample rules

Data Viewing & Processing

  • Visualization functions for easy comparisons of chromatograms for standards or samples
  • Data processing for transient signals
  • Automated or manual peak selection and integration techniques
  • Calibration curve building features

Advanced Reporting Functions

  • Automated read back functions for inline dilutions
  • Report function offers a comprehensive overview of the results including calibration curves, raw intensities, calculated concentrations, and chromatograms
  • QC exporting to a single .xlsx, .csv, or pdf file

Speciation Method

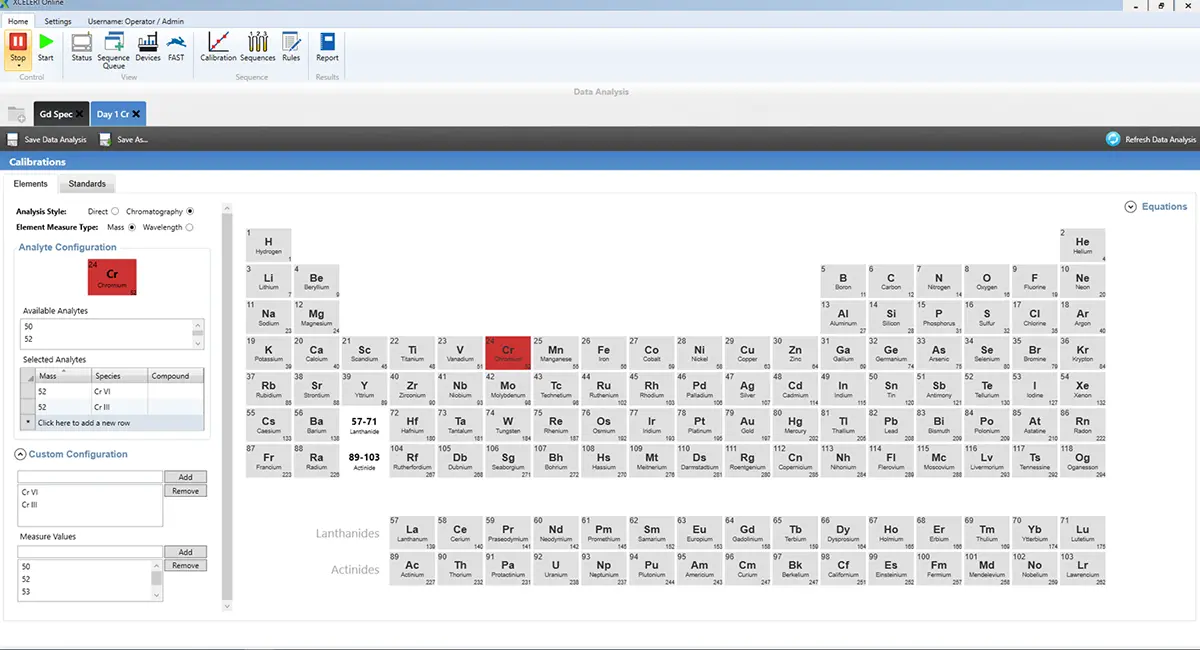
Screen shot example of the chromium speciation method. Element(s) of interest are selected then assigned the desired species that will be monitored. For example Cr VI and Cr III have been selected for this method. More than one element can be selected if the method requires monitoring multiple elements and species simultaneously.

Arsenic Speciation Method

Chromatogram Viewing

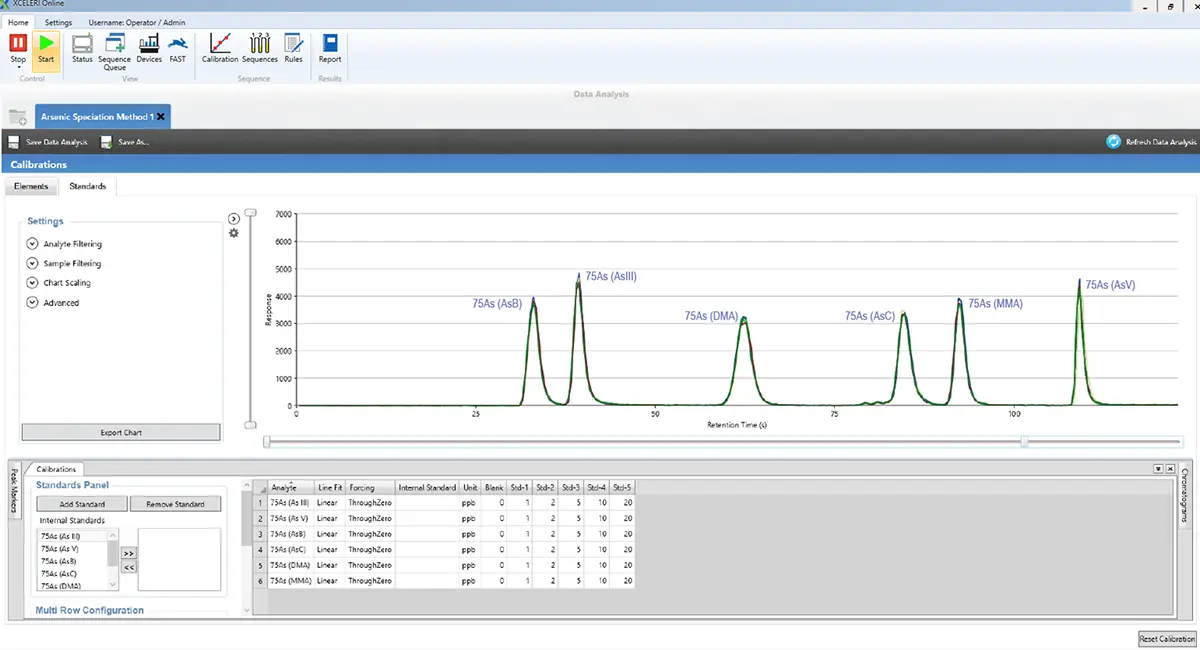
An example arsenic species method (AsB, As III, DMA, AsC, MMA, and As V). Data from standards or samples can be easily overlaid for comparison purposes.

Chromatogram Viewing

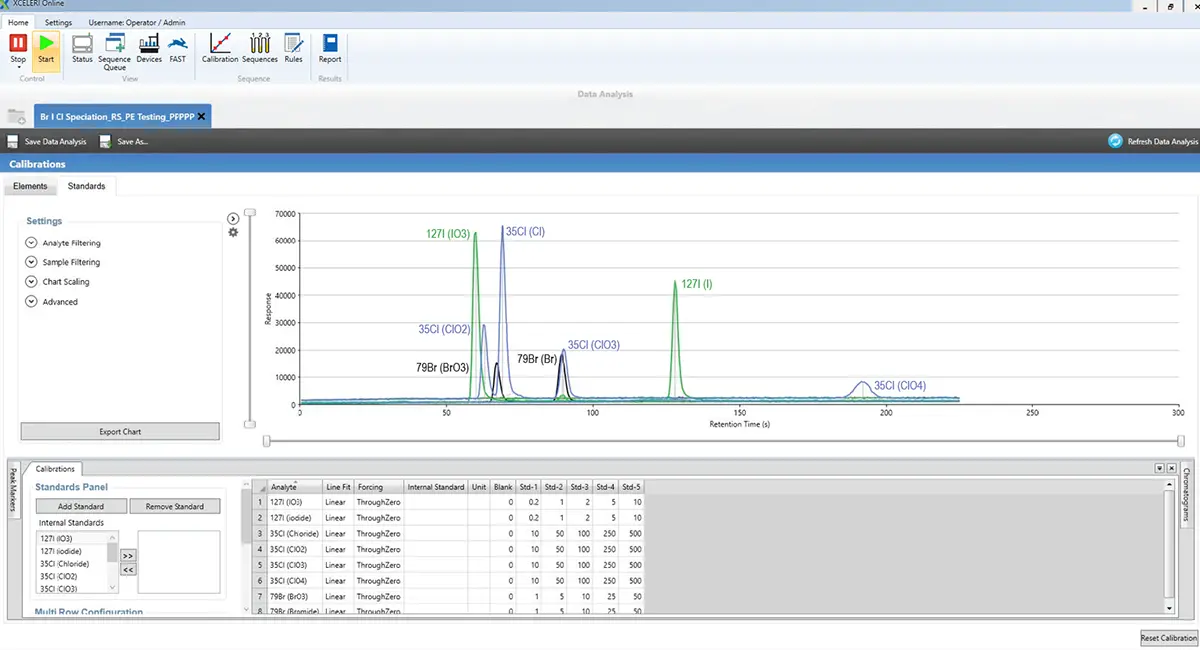
An example halogen species method (Br, BrO3, I, IO3, Cl, ClO2, ClO3, and ClO4). The example here shows how multiple elements being monitored can be displayed at one time.

Chromatogram Viewing

QC/Sample Rules

This page allows users to set custom QC rules and sample rules. The example below shows sample rules that will automatically flag a sample result over the specified value and rerun that sample with a new dilution factor of 100X.

QC/Sample Rules

Report Function

Calibration curves can be easily created and viewed using the Xceleri software. After transient peaks are identified, the software uses the integrated peak data along with the defined standards concentrations to create calibration curves for each species.

The report option has the ability to view each chromatogram individually, the integrated peak intensities, the calculated concentrations, and the calibration curves.

Report Function

Export Function

All data can be exported directly to a .csv or .xlsx. This excel file (.xlsx) option contains all of the data including the chromatograms, peak area intensities, concentrations, and calibration curves. This allows easy report generating when needing to send data off to customers, QC review, or lab managers.

Product Brochures

Xceleri Software Brochure
 

Contact us for information on Xceleri Software!

Contact Us